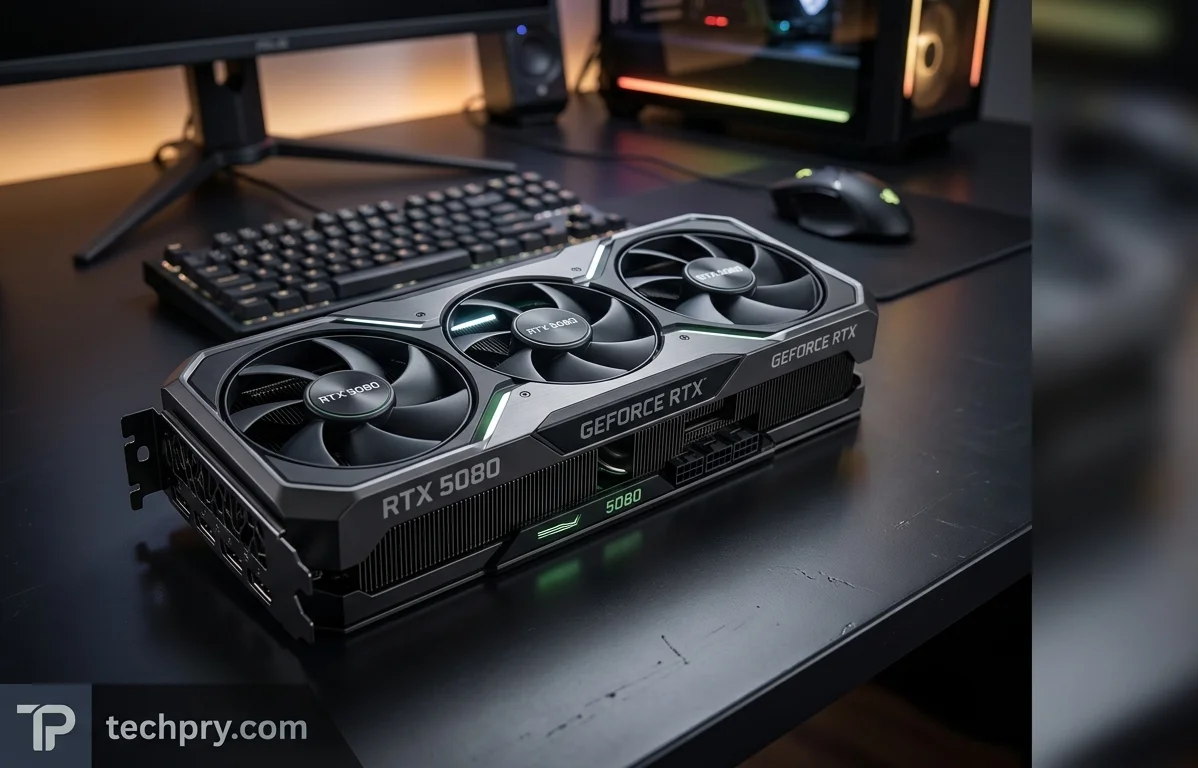
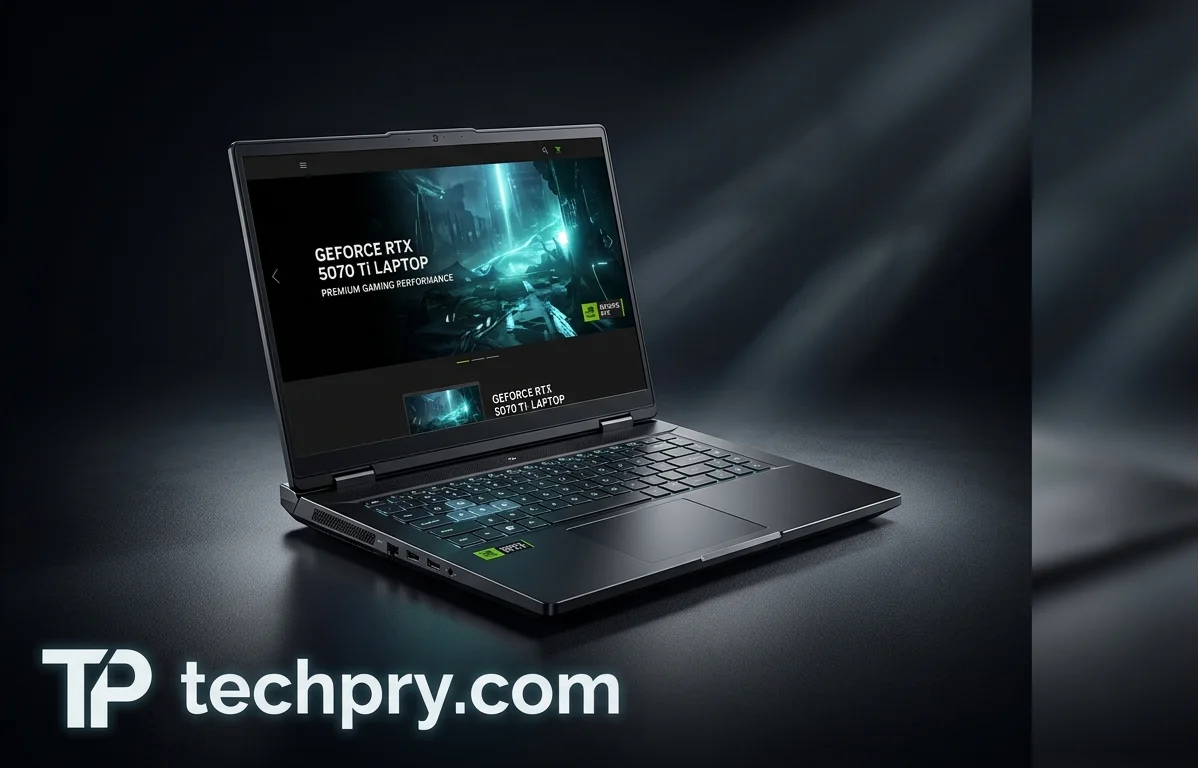
Scores and values marked with a red asterisk (*) are approximate, as we currently do not have sufficient test results to make a precise estimation.
Scores
| Score | GeForce RTX 5080 | GeForce RTX 5070 Ti Laptop |
|---|
| AI |
78
|
31*
|
| Efficiency |
92*
|
92*
|
| Overall score |
87*
|
69*
|
Why is GeForce RTX 5080 better?
- Shader units: 10,752 vs 5888
- TMUs: 336 vs 184
- ROPs: 112 vs 80
- Compute units: 84 vs 46
- Tensor cores: 336 vs 184
- RT cores: 84 vs 46
No clear advantages in the compared specifications.
Why is GeForce RTX 5070 Ti Laptop better?
No clear advantages in the compared specifications.
Full comparison
Specifications, tests and benchmarks of the GeForce RTX 5080 and GeForce RTX 5070 Ti Laptop side by side
DifferentSameBetter
Overview
| Specification | GeForce RTX 5080 | GeForce RTX 5070 Ti Laptop |
|---|
| Vendor |
Nvidia | Nvidia |
| Type |
Discrete | Discrete |
| Released |
January 7, 2025 | January 7, 2025 |
| Launch price |
$999 | N/A |
| Form factor |
Desktop | Laptop |
| Use |
Gaming | Gaming |
| Segment |
High-end | Mid-range |
| Architecture |
Blackwell 2.0 | Blackwell 2.0 |
| Codename |
GB203-400 | GB205-200 |
| Recommended CPU |
- Intel Core Ultra 7 265K or above | - Intel Core Ultra 7 255HX or above |
Graphics processor
| Specification | GeForce RTX 5080 | GeForce RTX 5070 Ti Laptop |
|---|
| Base clock |
2295 MHz | 847-1762 MHz (configurable) |
| Boost clock |
2617 MHz | 1447-2280 MHz (configurable) |
| Shader units |
10,752 | 5888 |
| TMUs |
336 | 184 |
| ROPs |
112 | 80 |
| Compute units |
84 | 46 |
| Tensor cores |
336 | 184 |
| RT cores |
84 | 46 |
| L1 cache |
128KB per cluster | 128KB per cluster |
| L2 cache |
64MB shared | 48MB shared |
| IPC |
2 IPC | 2 IPC |
Memory
| Specification | GeForce RTX 5080 | GeForce RTX 5070 Ti Laptop |
|---|
| Type |
GDDR7 | GDDR7 |
| Size |
16 GB | 12 GB |
| Bus |
256-bit | 192-bit |
| ECC |
No | No |
| Bandwidth |
960 GB/s | 672 GB/s |
| Memory Clock |
1875 MHz | 1750 MHz |
| Effective Memory Speed |
30,000 Mbps | 28,000 Mbps |
Power and build
| Specification | GeForce RTX 5080 | GeForce RTX 5070 Ti Laptop |
|---|
| Interface |
PCIe 5.0 x16 | PCIe 5.0 x16 |
| TGP |
360 W | 60-140 W (configurable) |
| Foundry |
TSMC | TSMC |
| Process node |
4 nm | 4 nm |
| Die size |
378 mm² | 263 mm² |
| Transistors |
45.6 billion | 31.1 billion |
| Transistor density |
120.63 MTr/mm² | 118.25 MTr/mm² |
Features
| Specification | GeForce RTX 5080 | GeForce RTX 5070 Ti Laptop |
|---|
| DirectX |
12.2 | 12.2 |
| Vulkan |
1.4 | 1.4 |
| OpenGL |
4.6 | 4.6 |
| OpenCL |
3.0 | 3.0 |
| CUDA |
12.0 | 12.0 |
| Ray tracing |
Yes | Yes |
| Upscaling |
DLSS 4 | DLSS 4 |
| DisplayPort |
2.1b | 2.1b |
3DMark
| Specification | GeForce RTX 5080 | GeForce RTX 5070 Ti Laptop |
|---|
| Steel Nomad Light |
- | - |
| Time Spy |
- | - |
| Solar Bay |
- | - |
| Port Royal |
- | - |
| Fire Strike |
- | - |
| Wild Life Extreme |
- | - |
| Night Raid |
- | - |
Geekbench 6 OpenCL
| Specification | GeForce RTX 5080 | GeForce RTX 5070 Ti Laptop |
|---|
| Compute score |
- | - |
Cinebench 2024 GPU
| Specification | GeForce RTX 5080 | GeForce RTX 5070 Ti Laptop |
|---|
| Score |
- | - |
PassMark
| Specification | GeForce RTX 5080 | GeForce RTX 5070 Ti Laptop |
|---|
| G3D Mark |
- | - |
| G2D Mark |
- | - |
| DirectX 11 |
- | - |
| DirectX 12 |
- | - |
| GPU compute |
- | - |
Blender
| Specification | GeForce RTX 5080 | GeForce RTX 5070 Ti Laptop |
|---|
| GPU score |
- | - |
Geekbench 6 ML
| Specification | GeForce RTX 5080 | GeForce RTX 5070 Ti Laptop |
|---|
| Single precision |
- | - |
| Half precision |
- | - |
| Quantized |
- | - |
FPS Table
| Specification | GeForce RTX 5080 | GeForce RTX 5070 Ti Laptop |
|---|
| Forza Horizon 5 |
250 186 179 138 | 168 112 102 77 |
| The Witcher 3 |
271 244 172 90 | 191 162 116 62 |
| Counter-Strike 2 |
317 238 178 87 | 273 202 144 80 |
| Far Cry 6 |
194 171 155 97 | 146 133 114 71 |
| Hogwarts Legacy |
185 152 124 67 | 118 94 74 40 |
| CoD: Modern Warfare III |
250 244 197 135 | 150 139 107 70 |
| Ghost of Tsushima |
166 142 126 82 | 105 89 73 43 |
| Cyberpunk 2077 |
213 192 138 61 | 129 117 76 37 |
| Shadow of the Tomb Raider |
306 276 214 111 | 211 190 147 80 |
Average FPS by Resolution
| Specification | GeForce RTX 5080 | GeForce RTX 5070 Ti Laptop |
|---|
| 1080p High |
239 | 166 |
| 1080p Ultra |
205 | 138 |
| 1440p Ultra |
165 | 106 |
| 4K Ultra |
96 | 62 |
| Margin of Error |
Low | Low |
Gaming FPS
| Specification | GeForce RTX 5080 | GeForce RTX 5070 Ti Laptop |
|---|
| Forza Horizon 5 (1080p High) |
250 FPS | 168 FPS |
| Forza Horizon 5 (1080p Ultra) |
186 FPS | 112 FPS |
| Forza Horizon 5 (1440p Ultra) |
179 FPS | 102 FPS |
| Forza Horizon 5 (4K Ultra) |
138 FPS | 77 FPS |
| The Witcher 3 (1080p High) |
271 FPS | 191 FPS |
| The Witcher 3 (1080p Ultra) |
244 FPS | 162 FPS |
| The Witcher 3 (1440p Ultra) |
172 FPS | 116 FPS |
| The Witcher 3 (4K Ultra) |
90 FPS | 62 FPS |
| Counter-Strike 2 (1080p High) |
317 FPS | 273 FPS |
| Counter-Strike 2 (1080p Ultra) |
238 FPS | 202 FPS |
| Counter-Strike 2 (1440p Ultra) |
178 FPS | 144 FPS |
| Counter-Strike 2 (4K Ultra) |
87 FPS | 80 FPS |
| Far Cry 6 (1080p High) |
194 FPS | 146 FPS |
| Far Cry 6 (1080p Ultra) |
171 FPS | 133 FPS |
| Far Cry 6 (1440p Ultra) |
155 FPS | 114 FPS |
| Far Cry 6 (4K Ultra) |
97 FPS | 71 FPS |
| Hogwarts Legacy (1080p High) |
185 FPS | 118 FPS |
| Hogwarts Legacy (1080p Ultra) |
152 FPS | 94 FPS |
| Hogwarts Legacy (1440p Ultra) |
124 FPS | 74 FPS |
| Hogwarts Legacy (4K Ultra) |
67 FPS | 40 FPS |
| Call of Duty (1080p High) |
250 FPS | 150 FPS |
| Call of Duty (1080p Ultra) |
244 FPS | 139 FPS |
| Call of Duty (1440p Ultra) |
197 FPS | 107 FPS |
| Call of Duty (4K Ultra) |
135 FPS | 70 FPS |
| Ghost of Tsushima (1080p High) |
166 FPS | 105 FPS |
| Ghost of Tsushima (1080p Ultra) |
142 FPS | 89 FPS |
| Ghost of Tsushima (1440p Ultra) |
126 FPS | 73 FPS |
| Ghost of Tsushima (4K Ultra) |
82 FPS | 43 FPS |
| Cyberpunk 2077 (1080p High) |
213 FPS | 129 FPS |
| Cyberpunk 2077 (1080p Ultra) |
192 FPS | 117 FPS |
| Cyberpunk 2077 (1440p Ultra) |
138 FPS | 76 FPS |
| Cyberpunk 2077 (4K Ultra) |
61 FPS | 37 FPS |
| Tomb Raider (1080p High) |
306 FPS | 211 FPS |
| Tomb Raider (1080p Ultra) |
276 FPS | 190 FPS |
| Tomb Raider (1440p Ultra) |
214 FPS | 147 FPS |
| Tomb Raider (4K Ultra) |
111 FPS | 80 FPS |
| Average FPS (1080p High) |
239 FPS | 166 FPS |
| Average FPS (1080p Ultra) |
205 FPS | 138 FPS |
| Average FPS (1440p Ultra) |
165 FPS | 106 FPS |
| Average FPS (4K Ultra) |
96 FPS | 62 FPS |
Compare other graphics cards