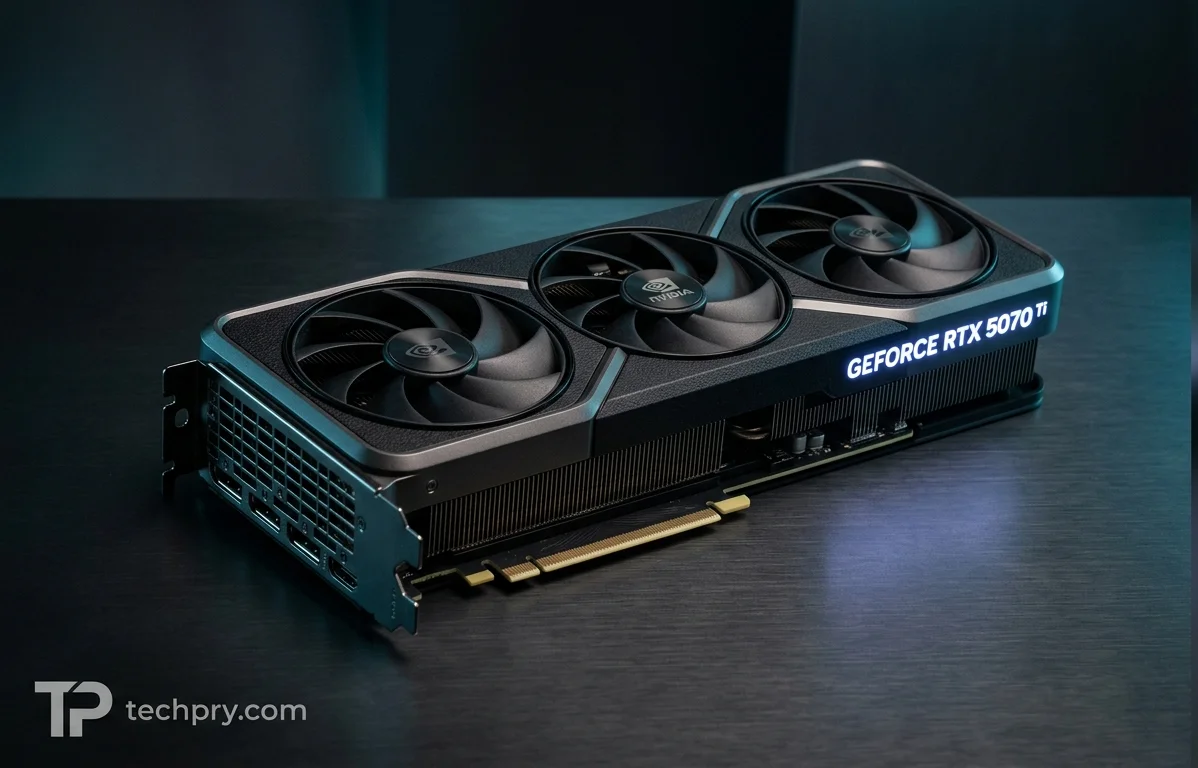
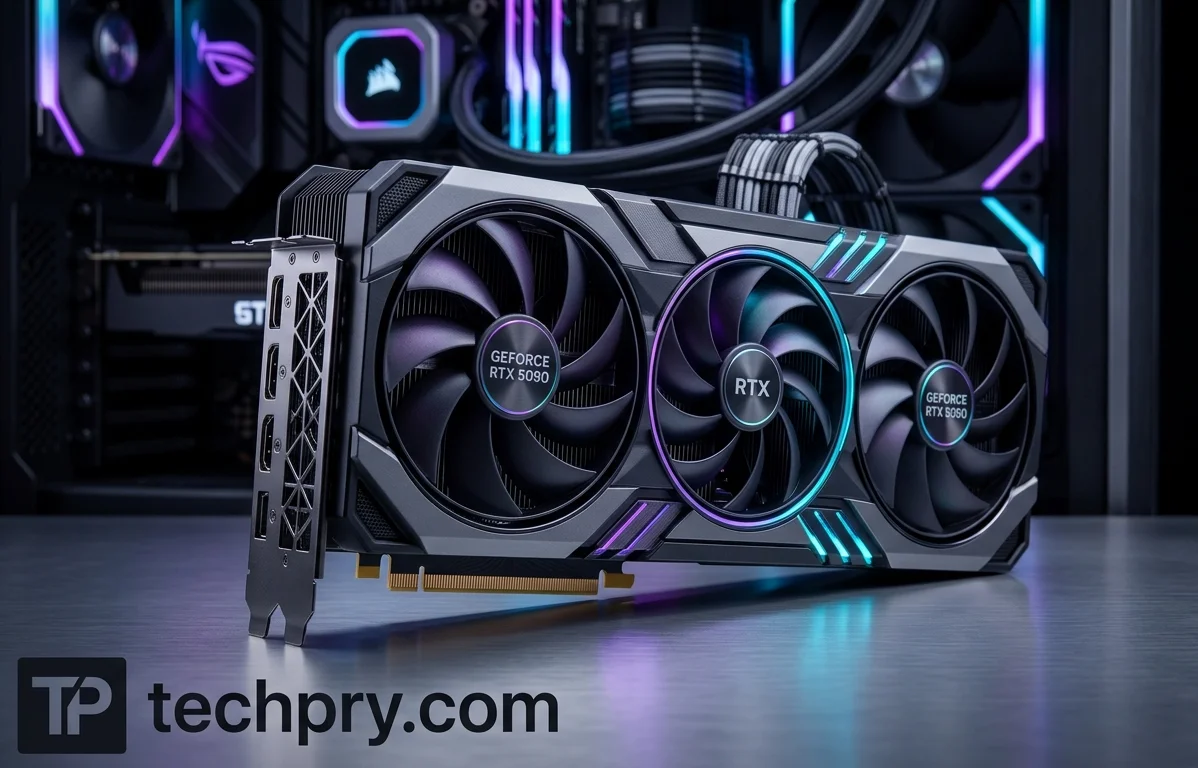
Scores and values marked with a red asterisk (*) are approximate, as we currently do not have sufficient test results to make a precise estimation.
Scores
| Score | GeForce RTX 5070 Ti | GeForce RTX 5090 |
|---|
| AI |
72
|
100
|
| Efficiency |
92*
|
92*
|
| Overall score |
85*
|
95*
|
Why is GeForce RTX 5070 Ti better?
- Base clock: 2295 MHz vs 2017 MHz
- Boost clock: 2452 MHz vs 2407 MHz
No clear advantages in the compared specifications.
Why is GeForce RTX 5090 better?
- Shader units: 21,760 vs 8960
- TMUs: 680 vs 280
- ROPs: 176 vs 96
- Compute units: 170 vs 70
- Tensor cores: 680 vs 280
- RT cores: 170 vs 70
No clear advantages in the compared specifications.
Full comparison
Specifications, tests and benchmarks of the GeForce RTX 5070 Ti and GeForce RTX 5090 side by side
DifferentSameBetter
Overview
| Specification | GeForce RTX 5070 Ti | GeForce RTX 5090 |
|---|
| Vendor |
Nvidia | Nvidia |
| Type |
Discrete | Discrete |
| Released |
January 7, 2025 | January 7, 2025 |
| Launch price |
$749 | $1999 |
| Form factor |
Desktop | Desktop |
| Use |
Gaming | Gaming |
| Segment |
Mid-range | High-end |
| Architecture |
Blackwell 2.0 | Blackwell 2.0 |
| Codename |
GB203-200-A1 | GB202-300 |
| Recommended CPU |
- Intel Core Ultra 5 245K or above | - Intel Core Ultra 9 285K or above |
| AMD Equivalent |
- Radeon RX 9070 XT | N/A |
Graphics processor
| Specification | GeForce RTX 5070 Ti | GeForce RTX 5090 |
|---|
| Base clock |
2295 MHz | 2017 MHz |
| Boost clock |
2452 MHz | 2407 MHz |
| Shader units |
8960 | 21,760 |
| TMUs |
280 | 680 |
| ROPs |
96 | 176 |
| Compute units |
70 | 170 |
| Tensor cores |
280 | 680 |
| RT cores |
70 | 170 |
| L1 cache |
128KB per cluster | 128KB per cluster |
| L2 cache |
48MB shared | 96MB shared |
| IPC |
2 IPC | 2 IPC |
Memory
| Specification | GeForce RTX 5070 Ti | GeForce RTX 5090 |
|---|
| Type |
GDDR7 | GDDR7 |
| Size |
16 GB | 32 GB |
| Bus |
256-bit | 512-bit |
| ECC |
No | No |
| Bandwidth |
896 GB/s | 1792 GB/s |
| Memory Clock |
1750 MHz | 1750 MHz |
| Effective Memory Speed |
28,000 Mbps | 28,000 Mbps |
Power and build
| Specification | GeForce RTX 5070 Ti | GeForce RTX 5090 |
|---|
| Interface |
PCIe 5.0 x16 | PCIe 5.0 x16 |
| TGP |
300 W | 575 W |
| Foundry |
TSMC | TSMC |
| Process node |
4 nm | 4 nm |
| Die size |
378 mm² | 750 mm² |
| Transistors |
45.6 billion | 92.2 billion |
| Transistor density |
120.63 MTr/mm² | 122.93 MTr/mm² |
Features
| Specification | GeForce RTX 5070 Ti | GeForce RTX 5090 |
|---|
| DirectX |
12.2 | 12.2 |
| Vulkan |
1.4 | 1.4 |
| OpenGL |
4.6 | 4.6 |
| OpenCL |
3.0 | 3.0 |
| CUDA |
12.0 | 12.0 |
| Ray tracing |
Yes | Yes |
| Upscaling |
DLSS 4 | DLSS 4 |
| DisplayPort |
2.1b | 2.1b |
3DMark
| Specification | GeForce RTX 5070 Ti | GeForce RTX 5090 |
|---|
| Steel Nomad Light |
- | - |
| Time Spy |
- | - |
| Solar Bay |
- | - |
| Port Royal |
- | - |
| Fire Strike |
- | - |
| Wild Life Extreme |
- | - |
| Night Raid |
- | - |
Geekbench 6 OpenCL
| Specification | GeForce RTX 5070 Ti | GeForce RTX 5090 |
|---|
| Compute score |
- | - |
Cinebench 2024 GPU
| Specification | GeForce RTX 5070 Ti | GeForce RTX 5090 |
|---|
| Score |
- | - |
PassMark
| Specification | GeForce RTX 5070 Ti | GeForce RTX 5090 |
|---|
| G3D Mark |
- | - |
| G2D Mark |
- | - |
| DirectX 11 |
- | - |
| DirectX 12 |
- | - |
| GPU compute |
- | - |
Blender
| Specification | GeForce RTX 5070 Ti | GeForce RTX 5090 |
|---|
| GPU score |
- | - |
Geekbench 6 ML
| Specification | GeForce RTX 5070 Ti | GeForce RTX 5090 |
|---|
| Single precision |
- | - |
| Half precision |
- | - |
| Quantized |
- | - |
FPS Table
| Specification | GeForce RTX 5070 Ti | GeForce RTX 5090 |
|---|
| Forza Horizon 5 |
229 164 155 121 | 336 247 233 187 |
| The Witcher 3 |
244 215 155 83 | 364 327 237 123 |
| Counter-Strike 2 |
298 221 172 86 | 363 265 202 99 |
| Far Cry 6 |
178 158 146 89 | 237 202 190 121 |
| Hogwarts Legacy |
160 131 107 58 | 249 199 166 97 |
| CoD: Modern Warfare III |
212 211 163 115 | 334 322 260 184 |
| Ghost of Tsushima |
144 122 109 70 | 221 185 175 113 |
| Cyberpunk 2077 |
193 176 122 55 | 261 233 160 77 |
| Shadow of the Tomb Raider |
279 265 207 106 | 329 302 238 128 |
Average FPS by Resolution
| Specification | GeForce RTX 5070 Ti | GeForce RTX 5090 |
|---|
| 1080p High |
215 | 299 |
| 1080p Ultra |
185 | 254 |
| 1440p Ultra |
148 | 207 |
| 4K Ultra |
87 | 125 |
| Margin of Error |
Low | Low |
Gaming FPS
| Specification | GeForce RTX 5070 Ti | GeForce RTX 5090 |
|---|
| Forza Horizon 5 (1080p High) |
229 FPS | 336 FPS |
| Forza Horizon 5 (1080p Ultra) |
164 FPS | 247 FPS |
| Forza Horizon 5 (1440p Ultra) |
155 FPS | 233 FPS |
| Forza Horizon 5 (4K Ultra) |
121 FPS | 187 FPS |
| The Witcher 3 (1080p High) |
244 FPS | 364 FPS |
| The Witcher 3 (1080p Ultra) |
215 FPS | 327 FPS |
| The Witcher 3 (1440p Ultra) |
155 FPS | 237 FPS |
| The Witcher 3 (4K Ultra) |
83 FPS | 123 FPS |
| Counter-Strike 2 (1080p High) |
298 FPS | 363 FPS |
| Counter-Strike 2 (1080p Ultra) |
221 FPS | 265 FPS |
| Counter-Strike 2 (1440p Ultra) |
172 FPS | 202 FPS |
| Counter-Strike 2 (4K Ultra) |
86 FPS | 99 FPS |
| Far Cry 6 (1080p High) |
178 FPS | 237 FPS |
| Far Cry 6 (1080p Ultra) |
158 FPS | 202 FPS |
| Far Cry 6 (1440p Ultra) |
146 FPS | 190 FPS |
| Far Cry 6 (4K Ultra) |
89 FPS | 121 FPS |
| Hogwarts Legacy (1080p High) |
160 FPS | 249 FPS |
| Hogwarts Legacy (1080p Ultra) |
131 FPS | 199 FPS |
| Hogwarts Legacy (1440p Ultra) |
107 FPS | 166 FPS |
| Hogwarts Legacy (4K Ultra) |
58 FPS | 97 FPS |
| Call of Duty (1080p High) |
212 FPS | 334 FPS |
| Call of Duty (1080p Ultra) |
211 FPS | 322 FPS |
| Call of Duty (1440p Ultra) |
163 FPS | 260 FPS |
| Call of Duty (4K Ultra) |
115 FPS | 184 FPS |
| Ghost of Tsushima (1080p High) |
144 FPS | 221 FPS |
| Ghost of Tsushima (1080p Ultra) |
122 FPS | 185 FPS |
| Ghost of Tsushima (1440p Ultra) |
109 FPS | 175 FPS |
| Ghost of Tsushima (4K Ultra) |
70 FPS | 113 FPS |
| Cyberpunk 2077 (1080p High) |
193 FPS | 261 FPS |
| Cyberpunk 2077 (1080p Ultra) |
176 FPS | 233 FPS |
| Cyberpunk 2077 (1440p Ultra) |
122 FPS | 160 FPS |
| Cyberpunk 2077 (4K Ultra) |
55 FPS | 77 FPS |
| Tomb Raider (1080p High) |
279 FPS | 329 FPS |
| Tomb Raider (1080p Ultra) |
265 FPS | 302 FPS |
| Tomb Raider (1440p Ultra) |
207 FPS | 238 FPS |
| Tomb Raider (4K Ultra) |
106 FPS | 128 FPS |
| Average FPS (1080p High) |
215 FPS | 299 FPS |
| Average FPS (1080p Ultra) |
185 FPS | 254 FPS |
| Average FPS (1440p Ultra) |
148 FPS | 207 FPS |
| Average FPS (4K Ultra) |
87 FPS | 125 FPS |
Compare other graphics cards